2021 researchfish submission data

The NC3Rs is dedicated to replacing, refining and reducing the use of animals in research and testing (the 3Rs). Our funding schemes are essential in delivering our mission by supporting the scientific community to develop, validate and apply 3Rs methods, tools and technologies. Additionally, our funding supports early career development, facilitates open innovation and commercialisation of 3Rs technologies, and bridges the gap between development and routine use of established 3Rs methods.
The data presented here combines data from our annual researchfish® submission in conjunction with data from our portfolio, including the proportion of awards for each 'R' and the areas of science represented. Our portfolio encompasses all awards made through our response mode funding schemes since 2004. This includes active and historic schemes but not awards made through the CRACK IT innovation programme. We have collected data via researchfish® annually since 2013 and in 2017 3Rs impacts were included as an additional question set. Some grant holders with awards that pre-date this have chosen to use researchfish®, where this data has been submitted it has been included in analysis, although the dataset is not complete.
NC3Rs funding schemes impacts
Introduction
The following section shows the NC3Rs portfolio as a whole and a breakdown of awards with data presented in this analysis.
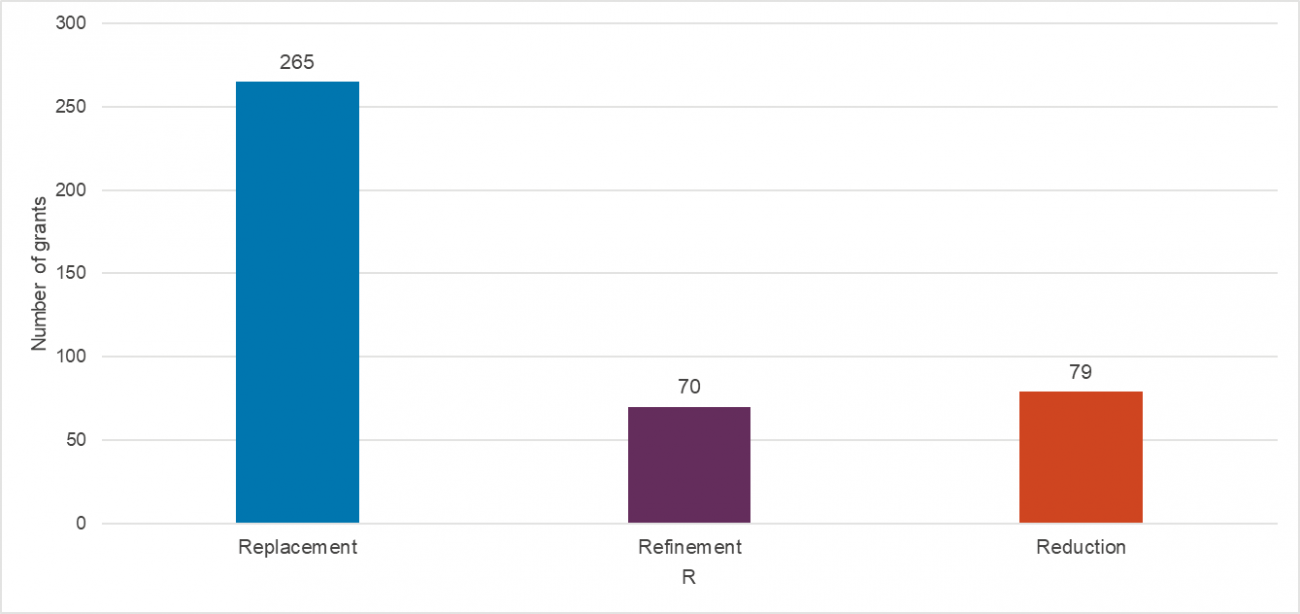
Portfolio summary by 'R'
Since 2004, over £48 million has been awarded to fund projects intended to replace the use of animals through NC3Rs response mode funding. A similar number of projects to reduce and refine the use of animals in research have been funded, with £15 million and £11 million committed respectively.
Portfolio summary by area of science
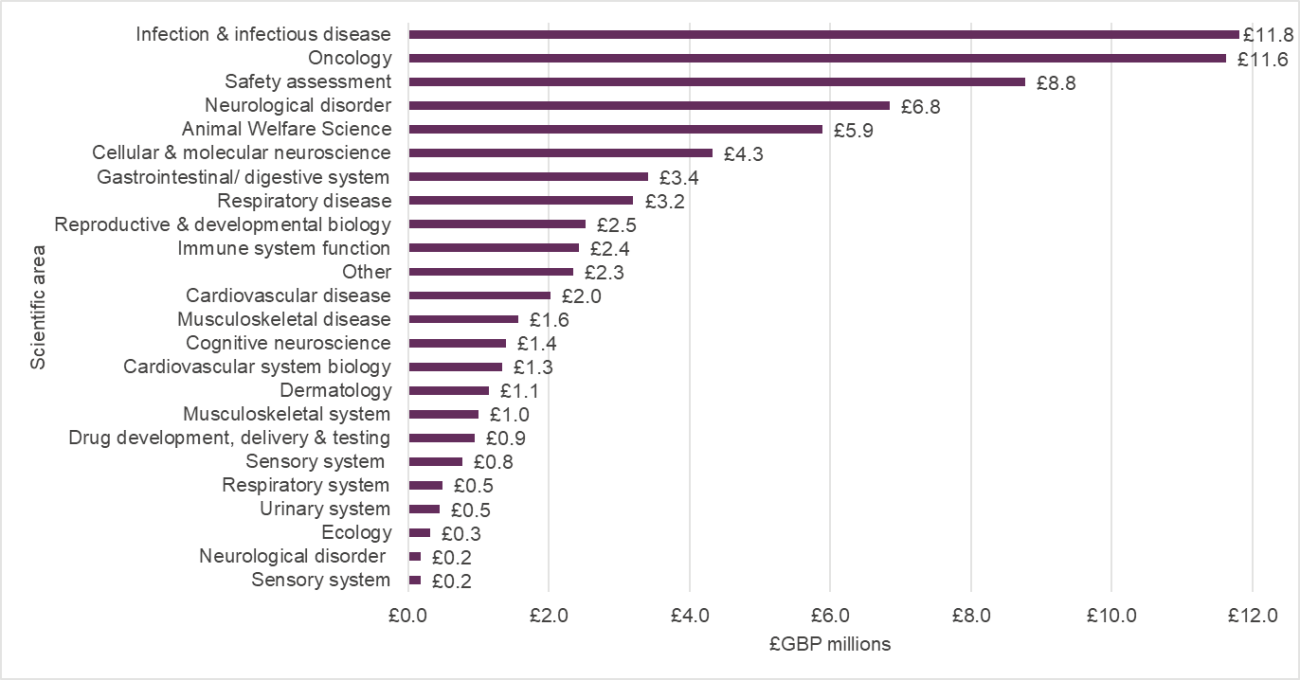
The NC3Rs funds a wide range of scientific areas each with the aim of replacing, refining or reducing the use of animals in research. Grants that do not fit these broad categories or have wider application are classified as other.
Portfolio summary by method development pipeline
Our funding schemes aim to drive the development of 3Rs methods and accelerate their uptake by others in the research community by building confidence through their validation and application. The majority of awards in our portfolio focus on the development and validation of new methods, tools and technologies.
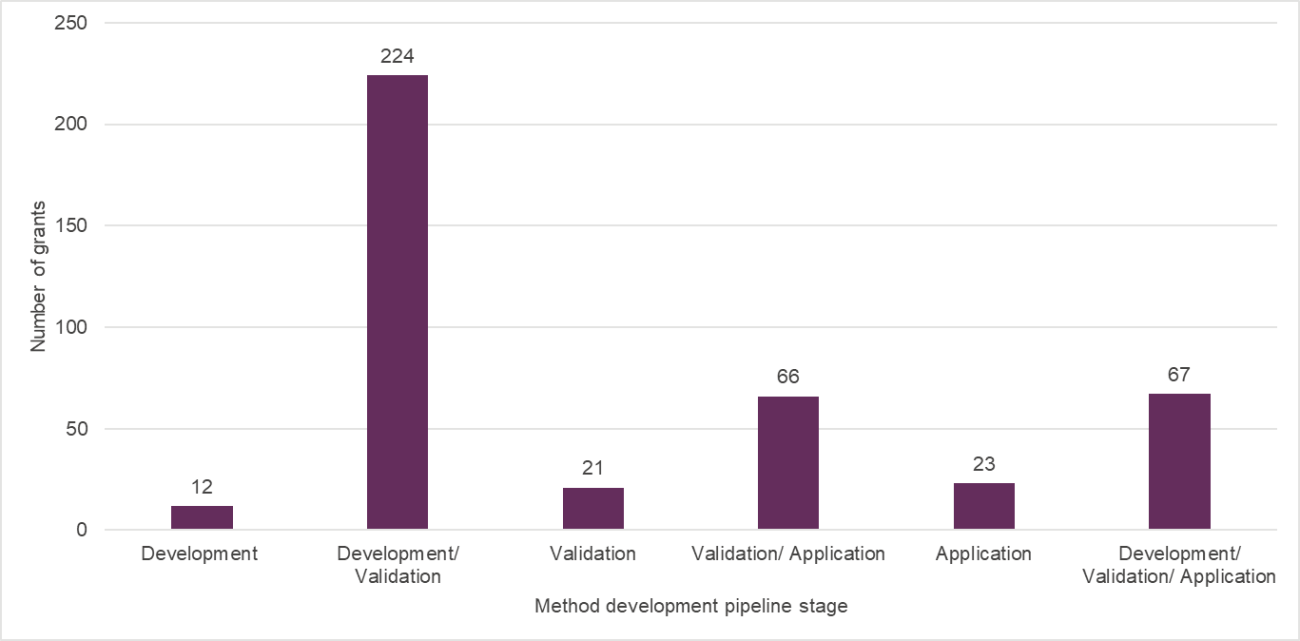
When the pipeline is weighted (i.e. a project focusing solely on development scores 1 in that category and 0 in validation and application whereas a grant focusing on all three stages would score 0.33 in each category) the stage most represented in the NC3Rs portfolio is validation.

Summary of grants submitting through researchfish®
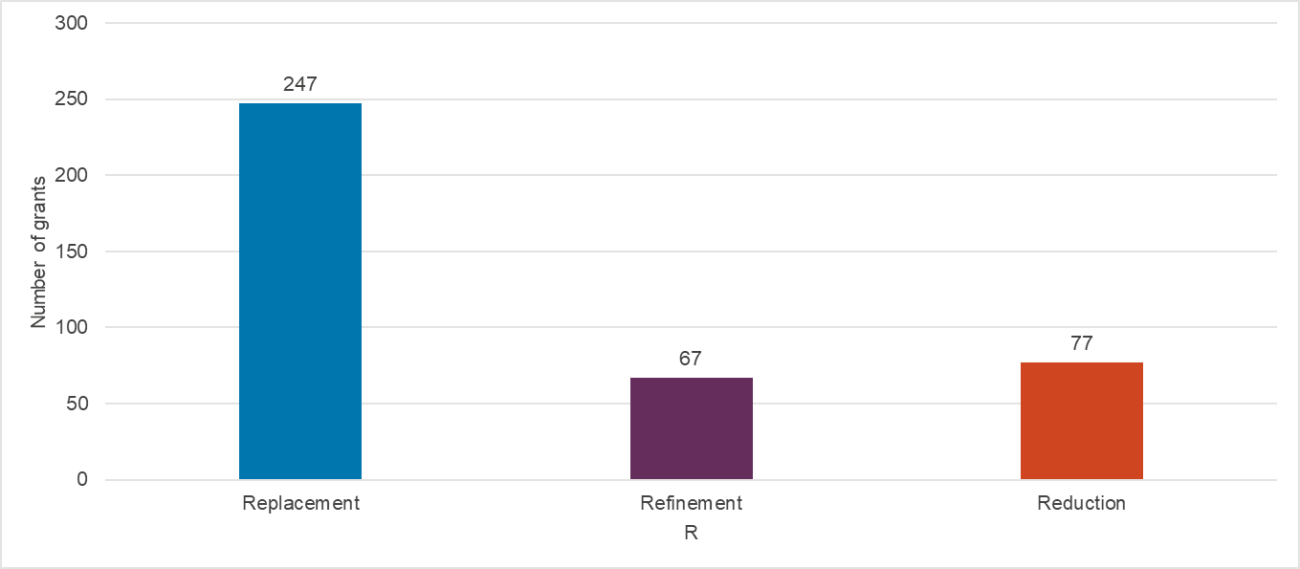
The most recent researchfish® submission period ran from 1 February 2021 to 11 March 2021. The NC3Rs had 398 awards (excluding CRACK IT Challenges research contracts) on the researchfish® system, of these 261 were expected to submit in the 2021 submission period. The report contains submitted data from 391 grants from 324 grant holders – these include 32 Fellowships, 181 Research grants (including Project grants, Pilot Studies, Skills and Knowledge Transfer, Infrastructure to Impact, Strategic and Technologies to Tools awards) and 136 Studentships representing approximately £71 million of NC3Rs awarded grants.
Breakdown of submissions by researchfish response code
The breakdown of submissions by researchfish® response code was as follows:
| Response code | Number of submissions | Descriptor |
|---|---|---|
| 1 | 223 | A submission is expected this year from the PI or Fellow. |
| 2 | 25 | No submission is expected this year. The PI or Fellow has been granted a one-year exemption. |
| 3 | 109 | No further submissions are expected against this award. The award is excluded from the Submission Period. |
| 4 | 33 | A submission is expected this year from the PI or Fellow but they are no longer working at the funded organisation. |
| 5 | 1 | The PI or Fellow is no longer expected to make a submission, but may still do so if they wish to add new outcomes. |
More information on response codes can be found on the researchfish website.
Reporting 3Rs impacts
Each NC3Rs award is classified according to the 'R' it is aiming to impact, this is termed the Primary 'R'. It is also possible that during the lifetime of a grant, the research impacts another of the 'R's, for example if a refined technique improves reproducibility and less animals are required. In this example, the Primary 'R' would be refinement and the Secondary 'R' reduction. This section describes the 3Rs impacts reported by NC3Rs grant holders through researchfish®.
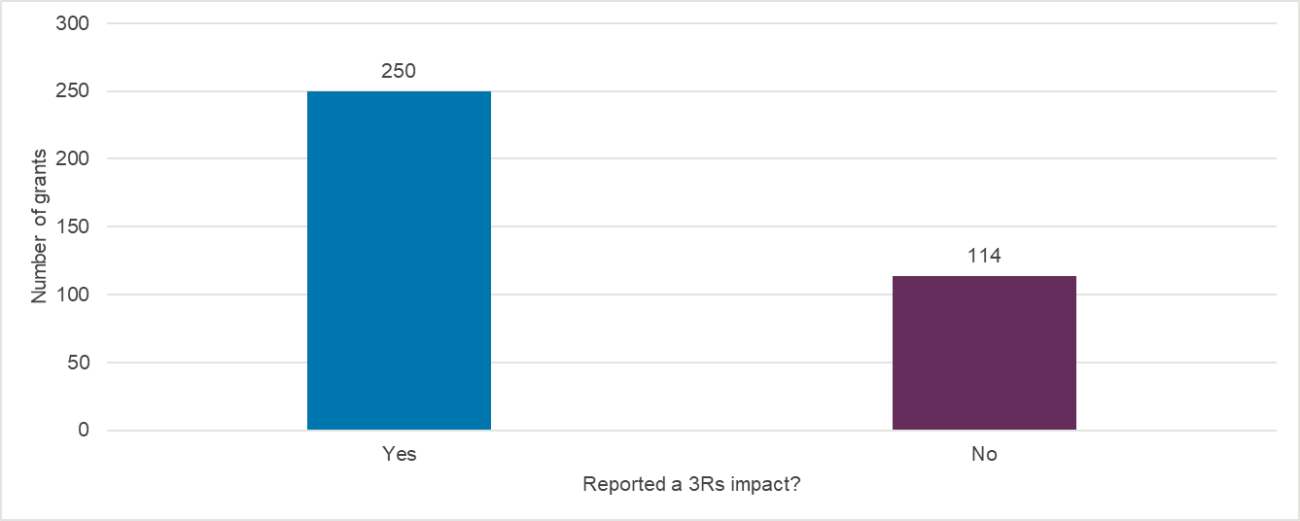
Grants reporting a 3Rs impact
On average, it takes a grant holder approximately two years to report a 3Rs impact for the first time. The majority of grants that have not reported 3Rs impacts are active awards, with 20 of these grants starting in the 12 months before the submission period.
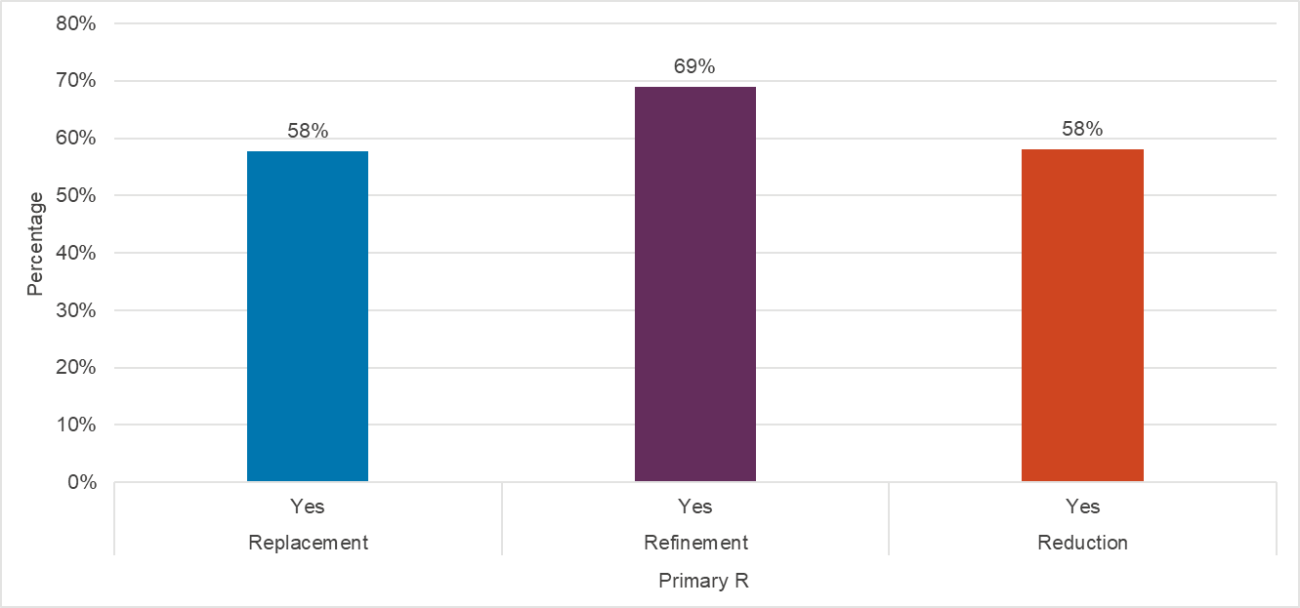
Impact in Primary 'R'
Over half of all NC3Rs awards that have submitted through researchfish® report an impact in their Primary 'R', this increases to over two-thirds of all awards when analysing only grants that have completed.
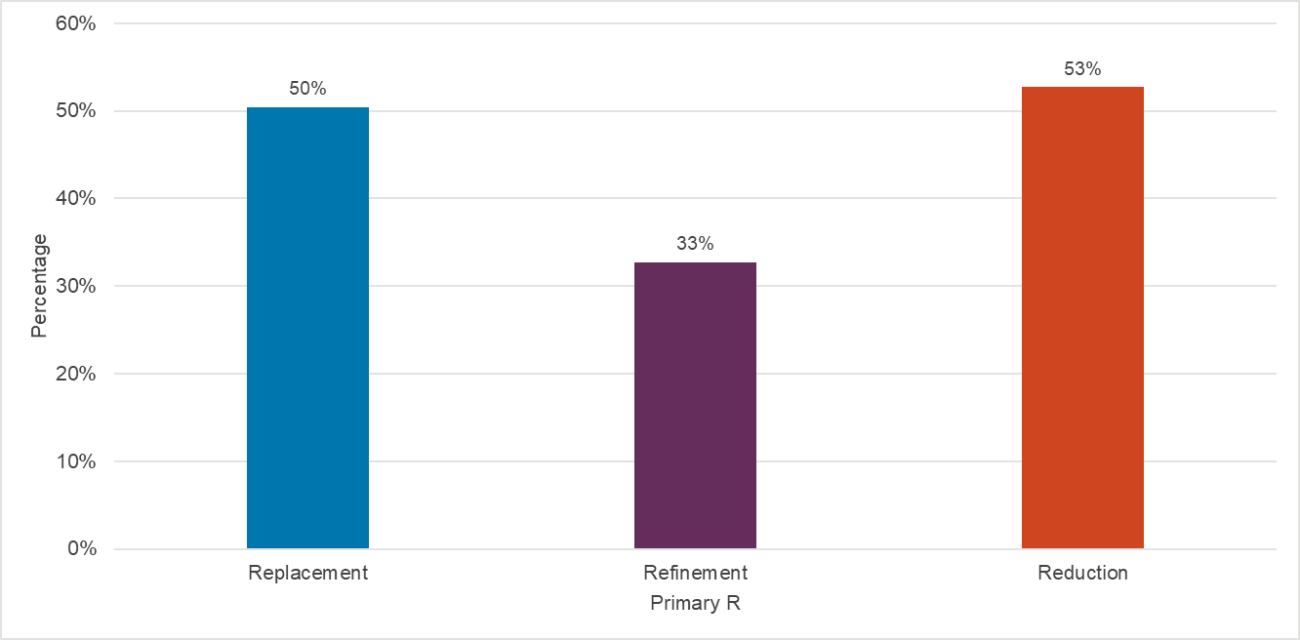
Impact in Secondary 'R'
During the lifecycle of a project, an award may also achieve impact in another 'R' (the Secondary 'R') in addition to the Primary 'R'. This is more often reported by grant holders with projects targeting replacement and reduction as their Primary 'R'.
Local impact in grant holder’s laboratory
Through researchfish®, NC3Rs grant holders report where they have achieved a 3Rs impact. Impacts can be achieved within their own laboratory (local), or more widely in laboratories within the UK (national) or within the global research community (international).
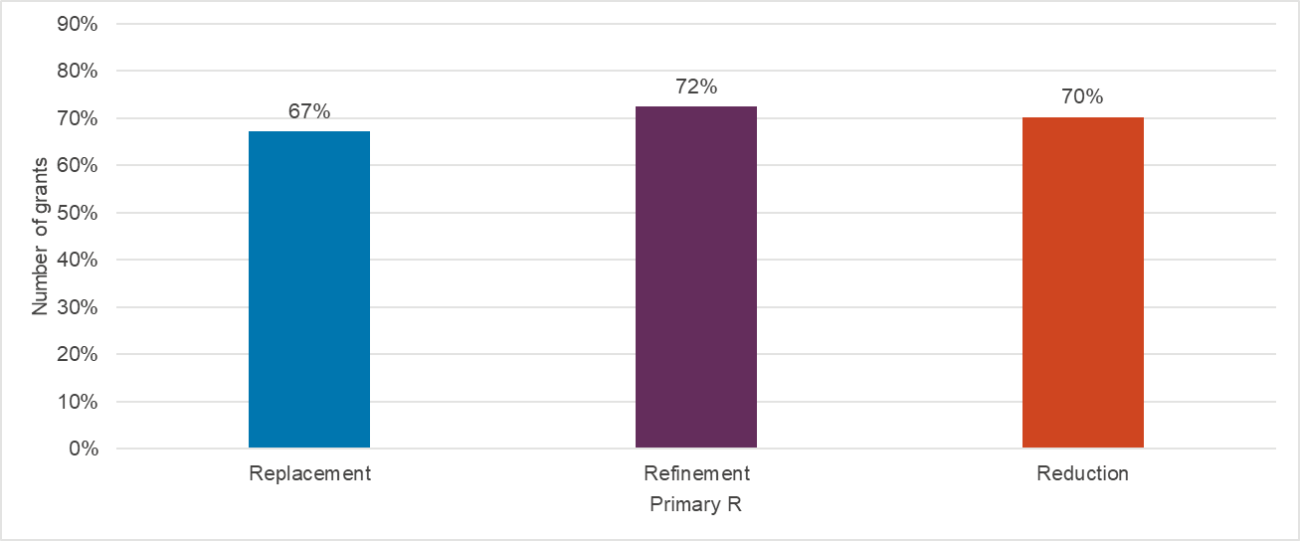
The first 3Rs impact expected as a result of NC3Rs funding is within the grant holder’s laboratory (we define this as a local impact). Some projects may not have a 3Rs impact locally, either because the award has been recently made and it is too early to expect impacts to have arisen in the timeframe, or the grant holder does not use animals in their own research.
Grants reporting a local 3Rs impact
Over 60% of NC3Rs grant holders report their award has resulted in 3Rs impacts in their laboratory. This analysis includes grants at various stages of the grant lifecycle from those that have recently started to those that completed a number of years ago. On average, it takes just under two years for a local 3Rs impact to be first reported.
Types of research material produced
Developing new 3Rs methods that impact the project, or the research of others is key to achieving the NC3Rs mission. 64% of the research methods generated by NC3Rs grant holders are assays or reagents, in vitro models, cell lines or non-mammalian models.

Impact in collaborating laboratories
The development of the 3Rs method and subsequent local impact in the researcher’s laboratory are likely to take place during the award but national and international impacts are more likely to occur outside the lifetime of the grant due to the time and investment required to fully develop, validate and disseminate a 3Rs model. The NC3Rs works closely with researchers to ensure 3Rs advances benefit others more widely across their institute and field, including providing the Skills and Knowledge Transfer award scheme to support dissemination.
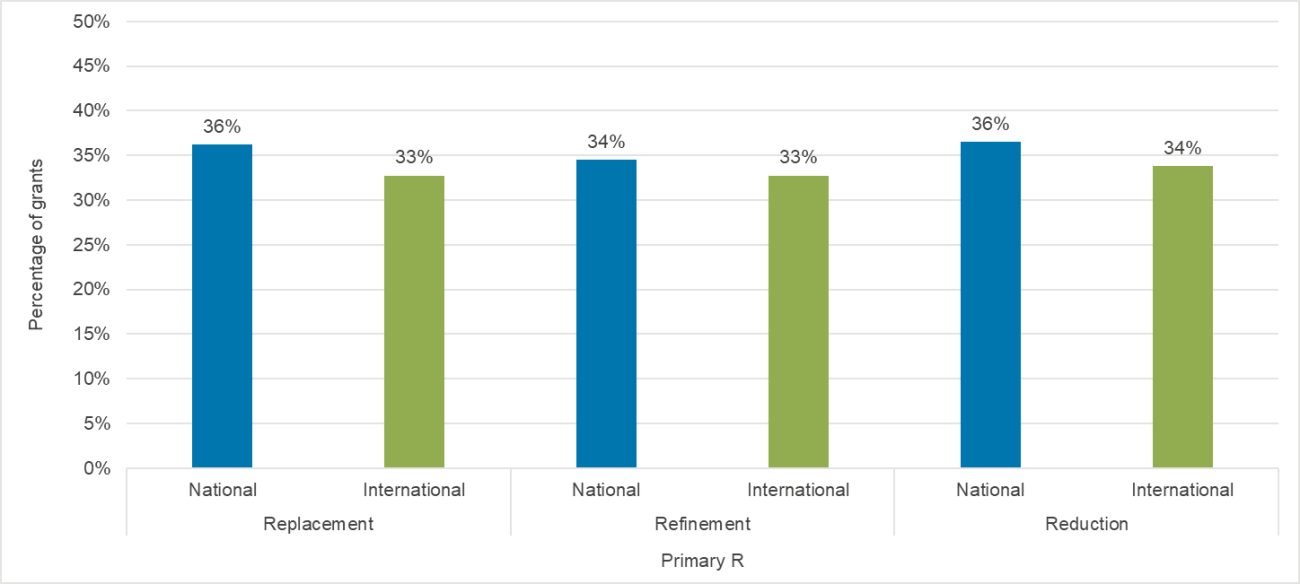
Grants reporting national or international 3Rs impacts
A key part to ensuring a developed method achieves a 3Rs legacy, where impact is sustained beyond the term of the award, is the uptake and application of the method by other researchers. Our grant holders report 45% of research materials developed through NC3Rs funding have been shared with other researchers.
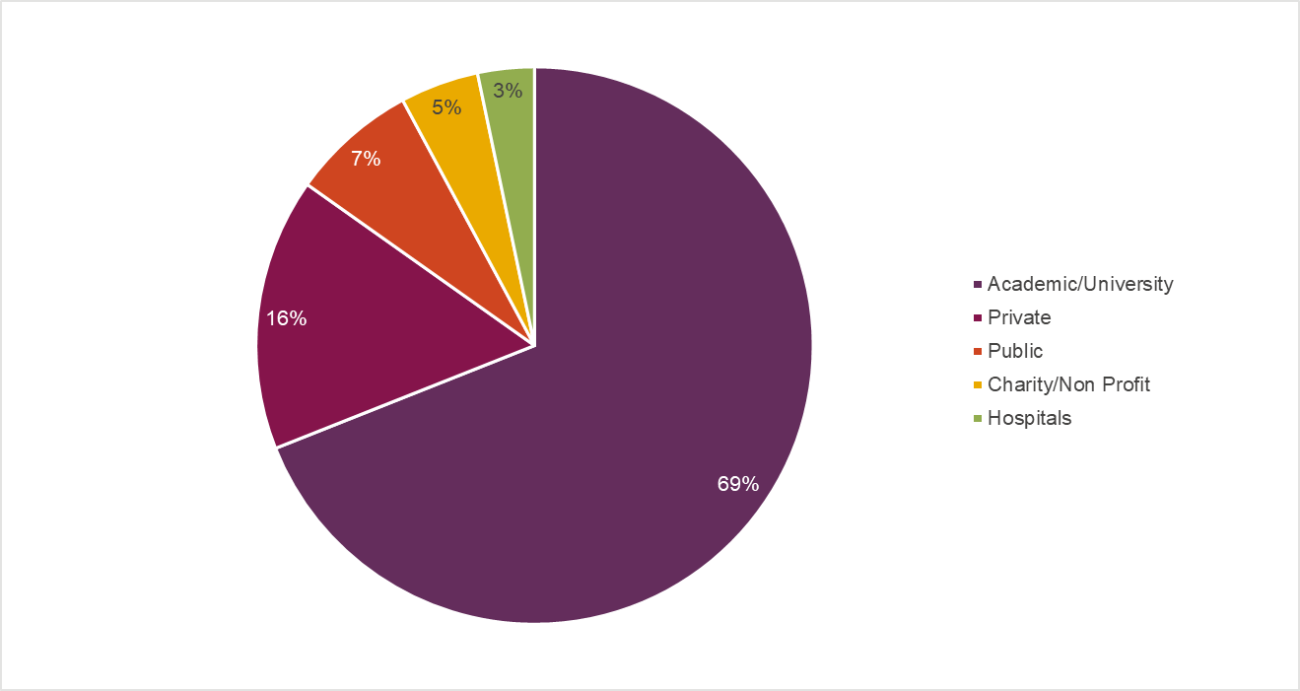
Collaborations by sector
The majority of collaborations formed by grant holders as a result of NC3Rs funding are with academic or industrial partners, 85% of all collaborations were reported as active collaborations at the time of researchfish® submission.
Publications describing developed methods
We encourage our grant holders to think actively about how to achieve a meaningful 3Rs impact. Publications are one element of dissemination and reporting the development, validation and application of 3Rs methods helps build confidence and acceptance in the wider research field. The analysis below highlights the publications reported by NC3Rs grant holders (including journal articles, book chapters, conference abstracts).
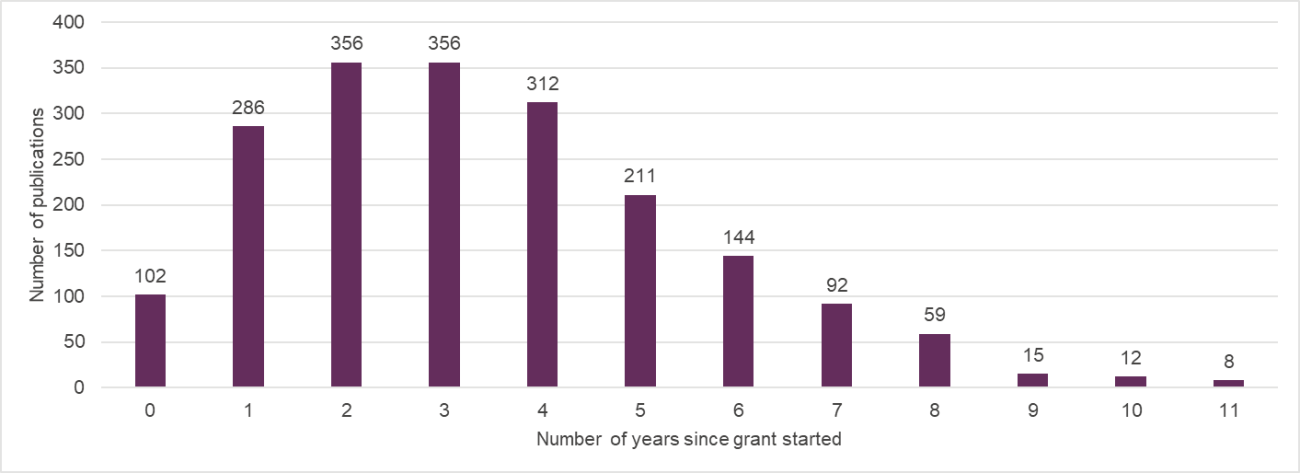
Time to publish from start of the grant
The average time taken for an NC3Rs grant holder to report a publication is three years after their grant begins.
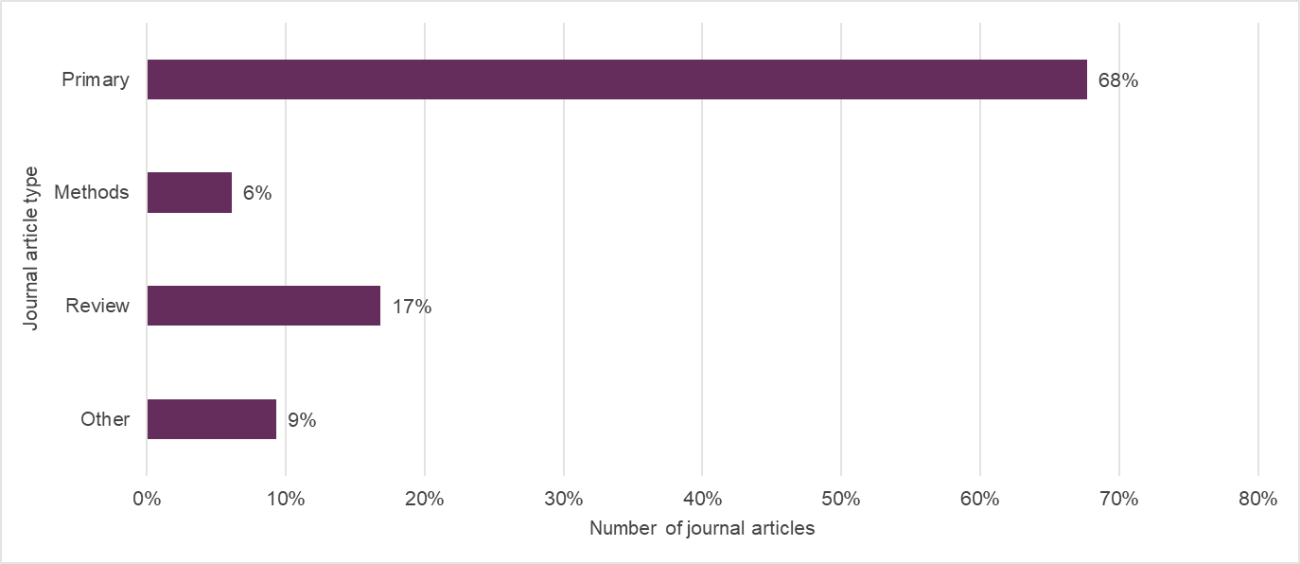
Types of journal articles
The majority of articles published by NC3Rs grant holders are primary research papers. ‘Other’ includes papers such as conference proceedings published in a journal, news/views articles and editorials.
Further investment
NC3Rs funding stimulates further funding for our grant holders, an important step in the uptake and legacy of an NC3Rs grant ensuring the continued use and impact of the developed method.
Time taken for instance of further funding to be reported
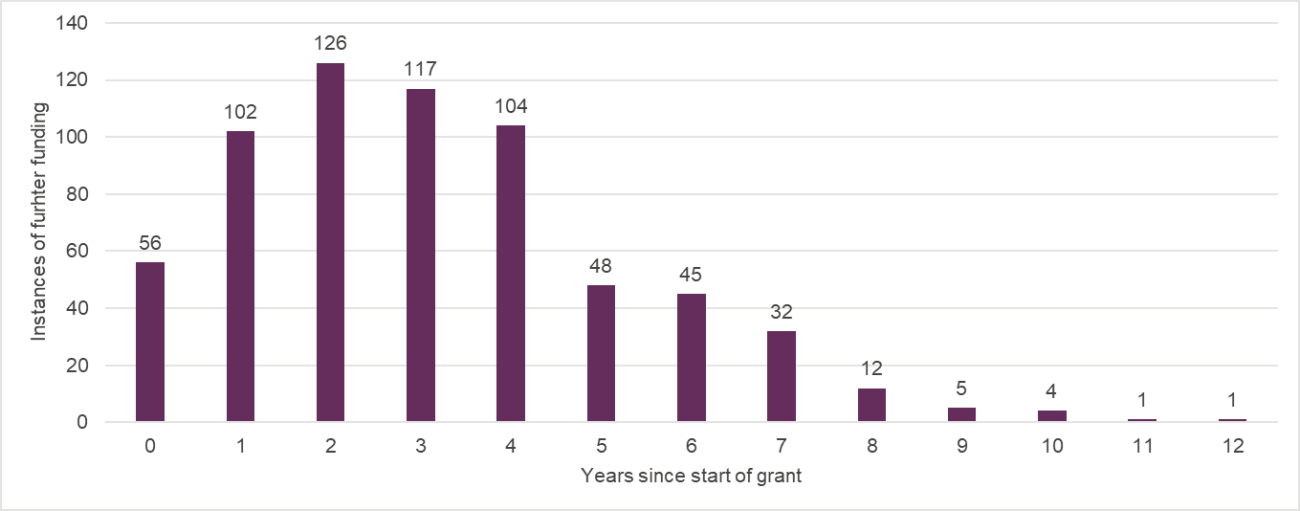
On average, NC3Rs grant holders report receiving further funding three years after the start date of their NC3Rs grant.
Types of further funding received
Research grants are the most frequently reported further funding type received by NC3Rs grant holders.

Sector of investment
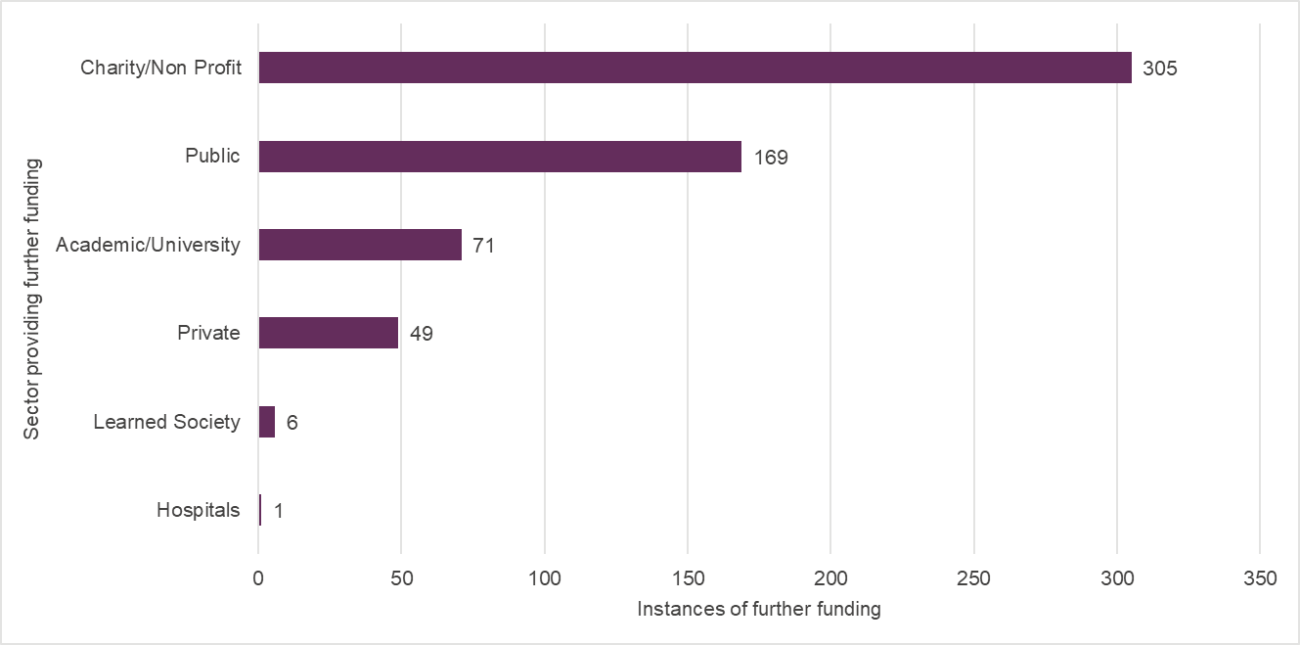
Our grant holders receive further funding from a variety of sectors outlined below.
Amount of further funding received
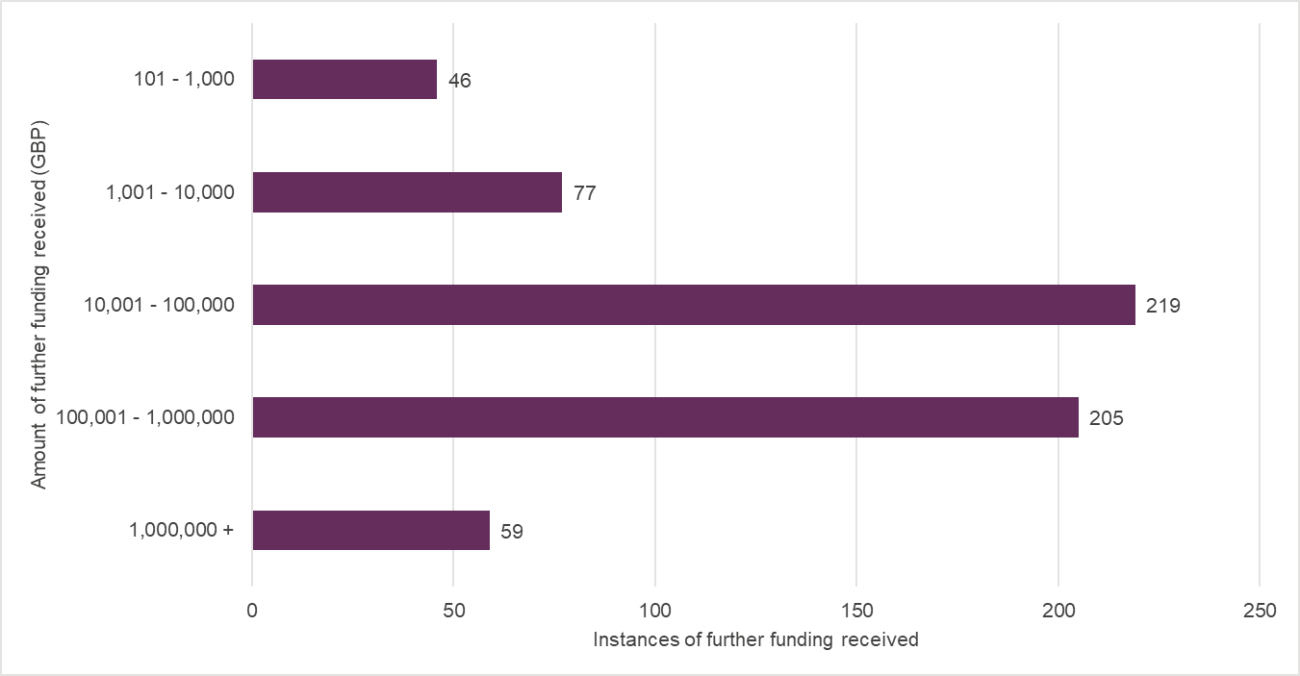
There were 654 instances of further funding reported from 198 NC3Rs awards. Further funding reported by NC3Rs grant holders has an average award value of £492k.
Spin-outs established
To date, five spin-out companies have been established as a result of NC3Rs response-mode funding schemes.
|
Company |
Year Established |
|---|---|
|
Destina Genomics |
2010 |
|
SimOmics |
2013 |
|
Xenobics |
2014 |
|
Neuralixer |
2014 |
|
Renovos Biologics Limited |
2017 |
Dissemination activities
Dissemination of NC3Rs-funded research to stakeholders, particularly those who may use the method or work within policy, is key to maximising the 3Rs impacts of a 3Rs method, tool or technology. Engagement activities can include presentations, workshops, open days, school visits, and articles published in magazines, newsletters or on an online platform.
Influence on policy
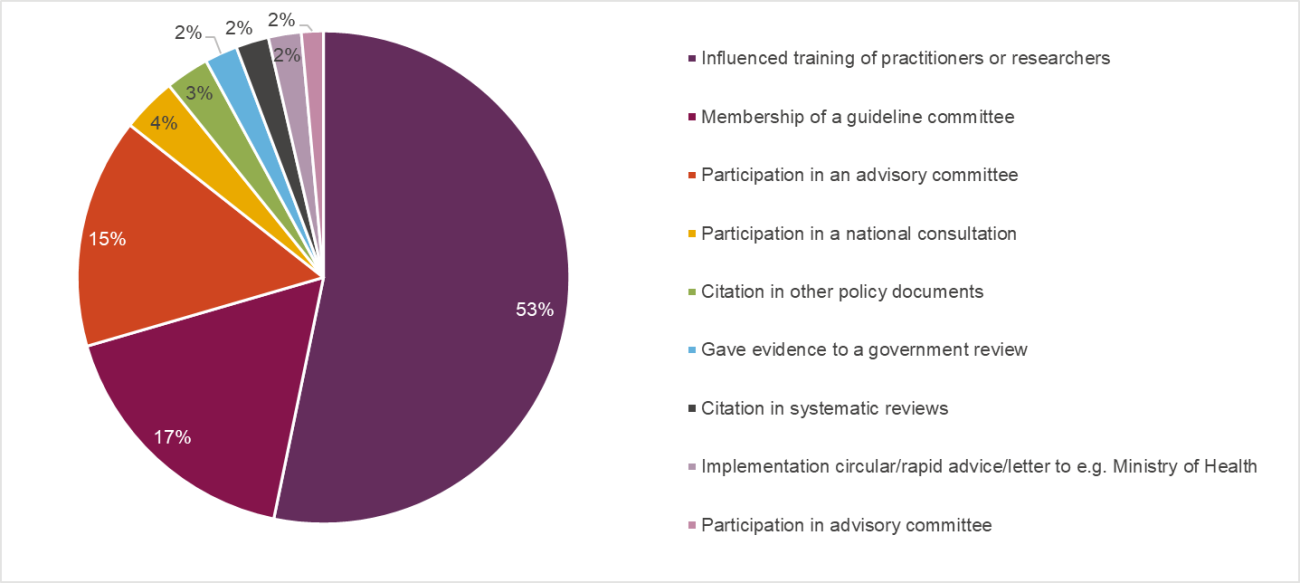
Influences on policies and practices can affect research, society or the economy. Over half of all policy influences reported by NC3Rs grant holders are directly influencing the training of other practitioners or researchers.
Types of engagement activity
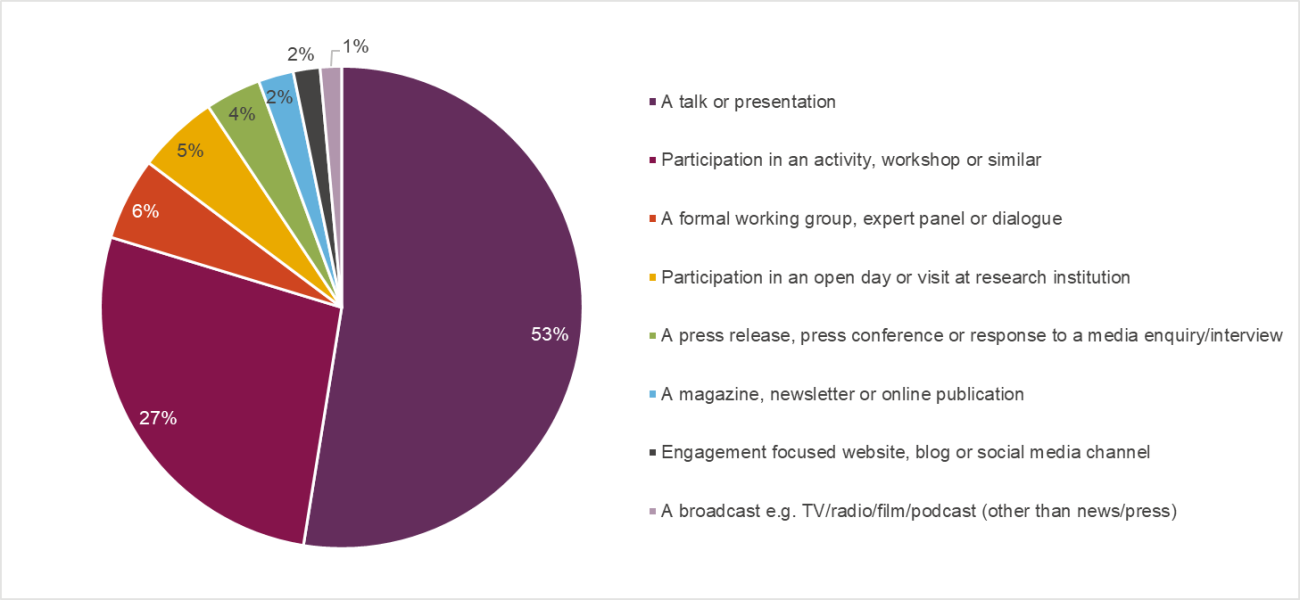
Talks and presentations are the most common engagement activity for NC3Rs grant holders followed by participating in activities and workshops.
Reach of engagement activities
42% of engagement activities reported by NC3Rs grant holders have an international reach.

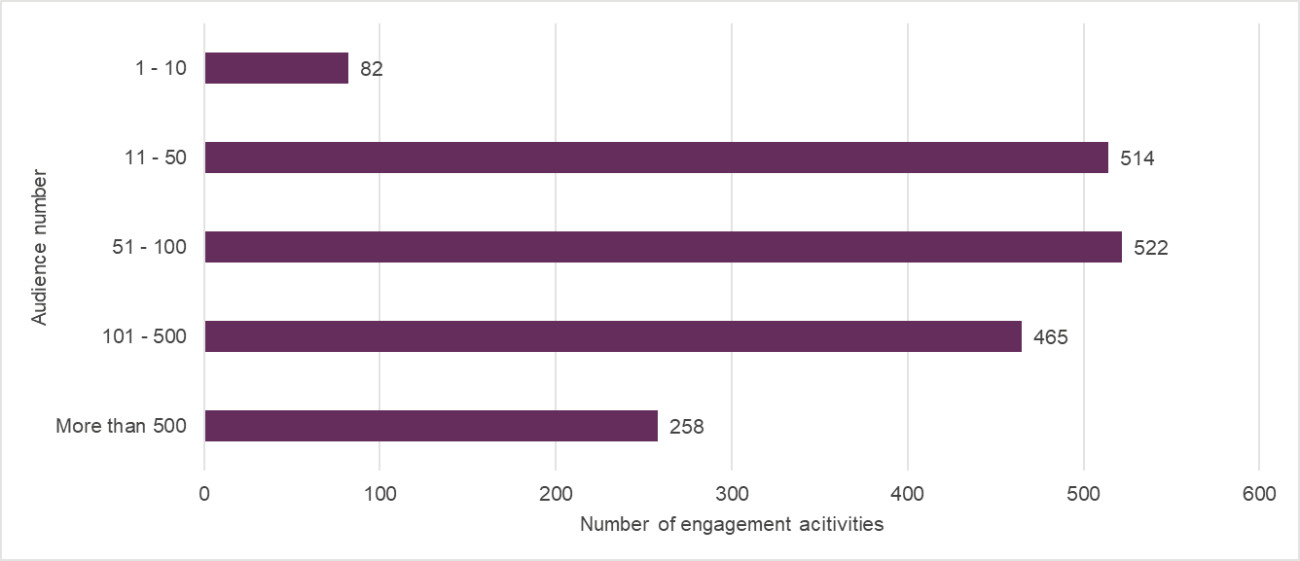
Audience numbers
Audience type
NC3Rs grant holders disseminate their research to a wide range of audiences, 60% of these are professional practitioners, the general public and postgraduate students.

Recognising NC3Rs grant holders
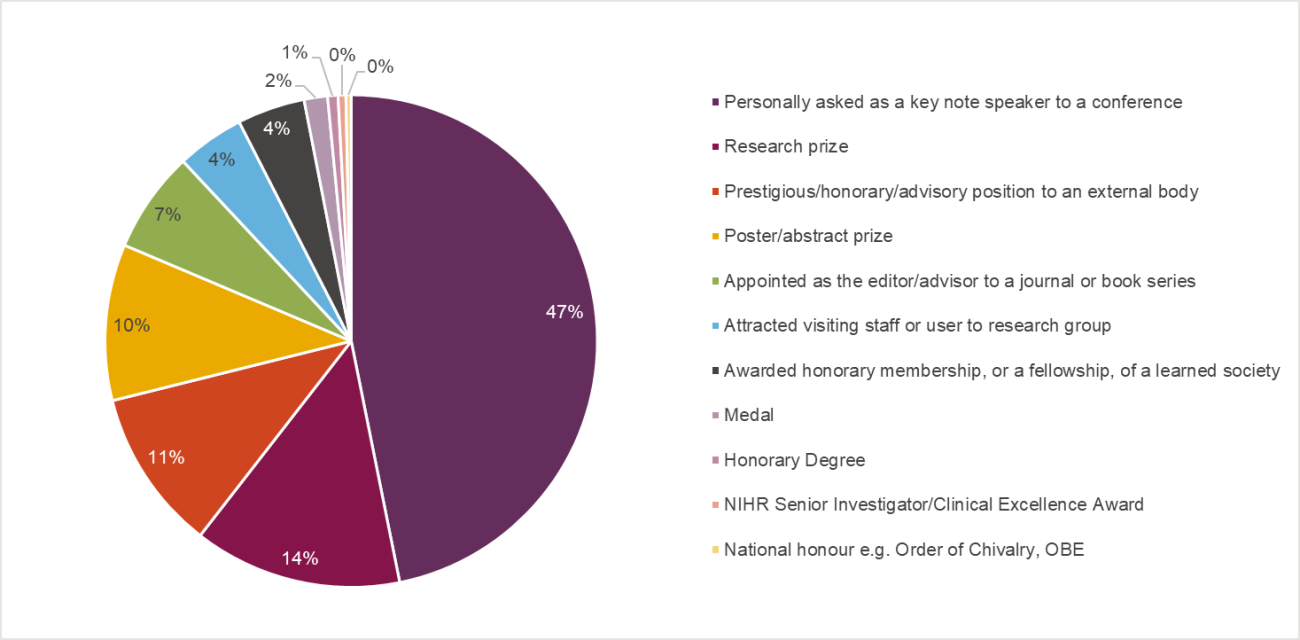
NC3Rs grant holders act as ambassadors for the 3Rs, both during the lifetime of their grant and beyond. Many NC3Rs grant holders are recognised for their research either in the form of a prize or being appointed to a prestigious position. Grant holders are also asked to report next destinations for researchers working on the project and what sector the new role is in. This section recognises the achievements of people working on NC3Rs grants.
Personal awards and recognition
Out of 299 NC3Rs grant holders included in this analysis, 75 reported having been invited as a keynote speaker to a conference.
Next destination of people leaving NC3Rs support
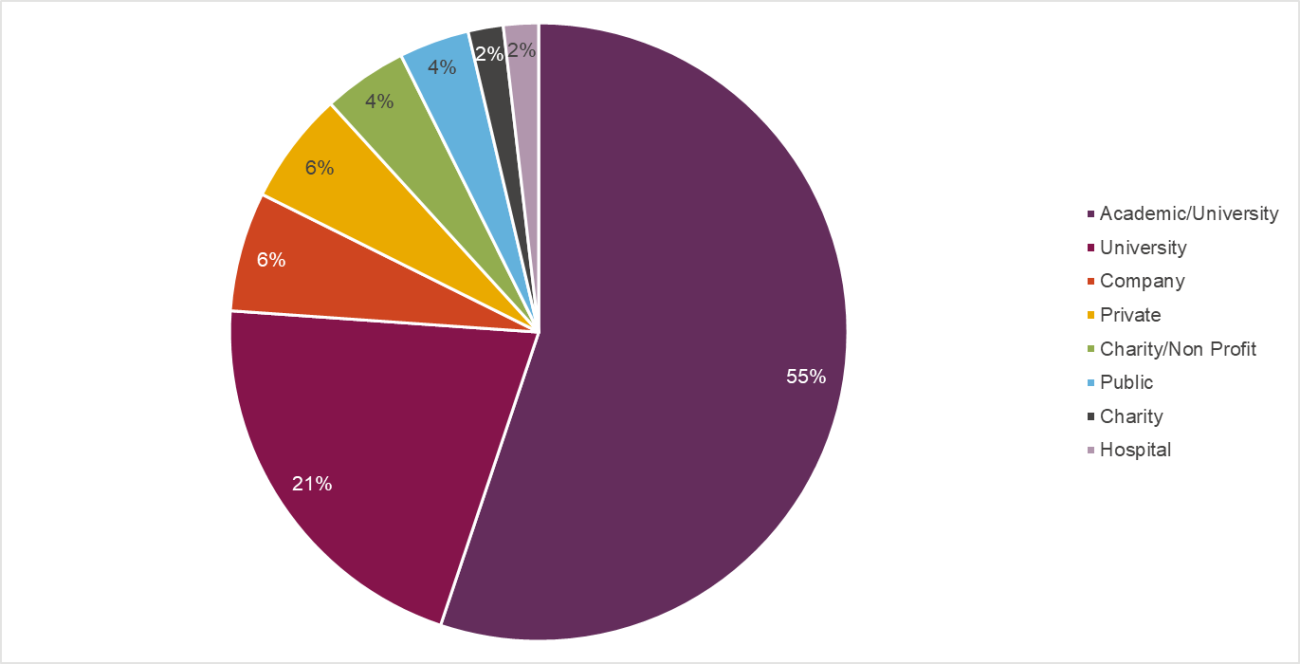
Where details about next destination are provided, 85% of people leaving NC3Rs support remain active in research in some capacity.
Diversity in funding data
Applications to the NC3Rs response mode funding schemes are made using the Je-S system, where applicants may provide data on protected characteristics when setting up an account. Where this information has been provided by applicants, it has been used in this analysis. Data has been presented on Principal Investigators (PIs), Co-Investigators (Co-Is) and Fellowship (Fellows) applicants and awardees for the calendar year 2020. For our PhD Studentship scheme, data from the Je-S system is only collected for the Principal Investigator.
Where possible we have also used data from the Higher Education Statistics Agency (HESA) from the 2019/20 academic year to provide further context into the academic community and highlight where our data align or differ. This data was accessed on 18 November 2021.
Percentage of applicants by age
The largest category of applicants for NC3Rs awards as Co-Is and PIs are those aged between 40 and 49. Applicants aged between 50 and 59 and 30 and 39 are the next largest groups respectively. For Fellows, the largest category of applicants is 30 to 39.

Percentage of applicants by disability
Disclosed disabilities are reported as between approximately 4% and 3% for PIs and Co-Is respectively. 5% of applicants disclosed a disability for the Training Fellowship scheme. Approximately 4% of the academic community disclose a disability in the HESA data.

Percentage of applicants by ethnicity
Ethnic minorities make up approximately 12%, 7% and 26% of applicants for NC3Rs grants as PIs, Co-Is and Fellows respectively. HESA data show that 16% of the academic community are part of an ethnic minority.

The number of applicants (PIs, Co-Is and Fellows) from ethnic minorities applying for NC3Rs awards has remained relatively constant over the last five years.

Percentage of applicants by gender
Applicants identifying as female comprised 40%, 42% and 58% of PIs, Co-Is and Fellows respectively for NC3Rs grants. Approximately 46% of the academic community identify as female according to data from HESA.

The percentage of female applicants (PIs, Co-Is and Fellows) to the NC3Rs has increased by approximately 6% in the last five years.

Comparison of award rates by gender and ethnicity
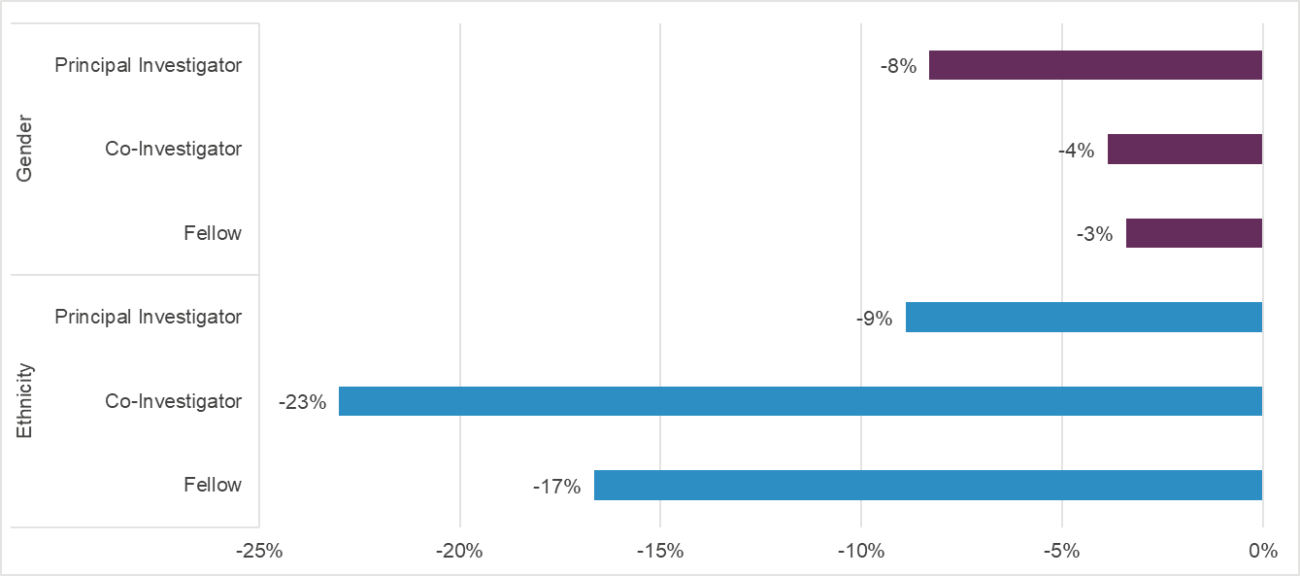
Applicants identifying as female have lower award rates than male PIs (-8%), Co-Is (-4%) and Fellows (-3%). The award rates for ethnic minorities applying are lower than white applicants for all roles, PIs (-9%) Co-Is (-23%) and Fellows (-17%).
Notes on researchfish data
researchfish® is an online platform used to gather outcomes and impacts arising from research. Grant holders report outputs into researchfish® that have resulted from, or are directly linked to, their NC3Rs awards. researchfish® is open to researchers all year round, but there is an annual submission period when researchers are asked to confirm that their information is accurate and up to date. All Grant holders are required to submit a report during the submission period for each year of their grant and typically for five years following the grant’s completion.
All averages have been calculated as the mean of data between 2013 and 2020 only as this is the period the NC3Rs have a complete set of reported researchfish® data. The data submitted via researchfish® is ‘cleaned’ by the NC3Rs team liaising with grant holders where necessary to check for accuracy, completeness and avoid duplication of data.
Each graph includes an ‘n’ number, which indicates the total sample presented in the graph. Differences between header statements (in highlighted boxes) and graph ‘n’ numbers are due to incomplete data for some of the categories of information presented in graphs. 0% indicates a value less than 1% that has been rounded down during analysis.
If you have any questions, comments or feedback on any aspect of this report please contact the NC3Rs funding team.
