Teaching experimental design with the EDA

Dr Becky Trueman and Professor Gareth Hathway have incorporated our Experimental Design Assistant (EDA) into undergraduate teaching at the University of Nottingham.
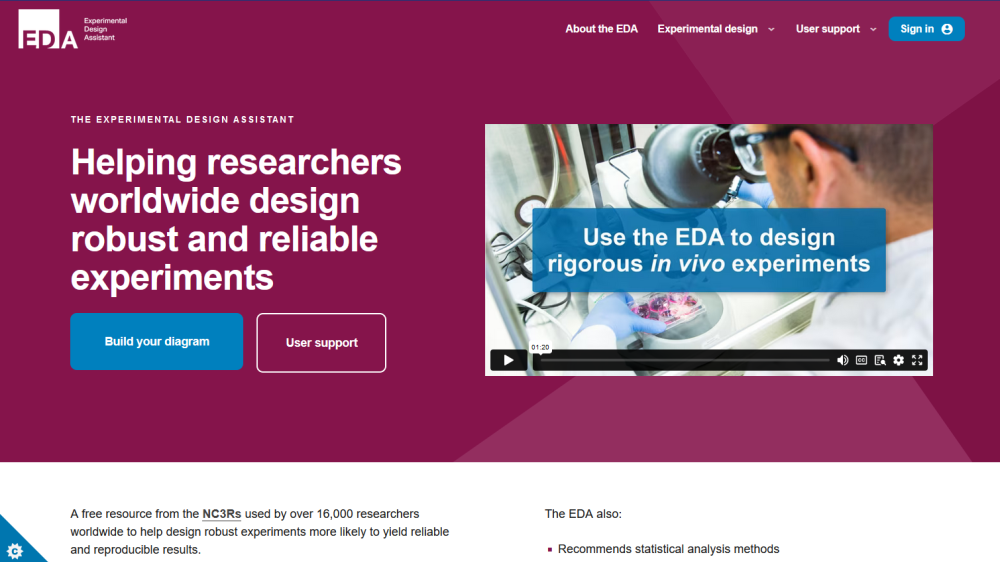
The statistical concepts than underpin experimental design can be tricky to teach, and even harder for students to put into practice. Over 20,000 researchers use our EDA tool to design and analyse in vivo experiments that are robust, meaningful and use the fewest number of animals needed to generate reliable results.
Becky and Gareth at University of Nottingham Faculty of Medicine and Health Sciences have embedded the EDA in the undergraduate module they teach on experimental design, giving students an opportunity to apply theoretical statistics from their lectures in a practical format that consolidates their learning and prepares them to plan their own experiments in the future. They tells us how it is going and share tips if you are interested in using the EDA as an engaging and practical way to teach experimental design.
Why did you decide to use the EDA in undergraduate teaching?
We wanted our students to develop a greater understanding of experimental design. Students are taught this in lectures but sometimes struggle to see how it is applied so we came up with the idea of using the EDA and designed a new module around this. We aimed it at second year undergraduate students, so that by their third year they would have a strong grounding in good experimental design, to enhance their critical analysis skills and to support their dissertation projects.
How did you design the module and support students to use the EDA?
We took an existing experimental design module that contained a number of practical sessions and write ups and expanded it to include three EDA workshops.
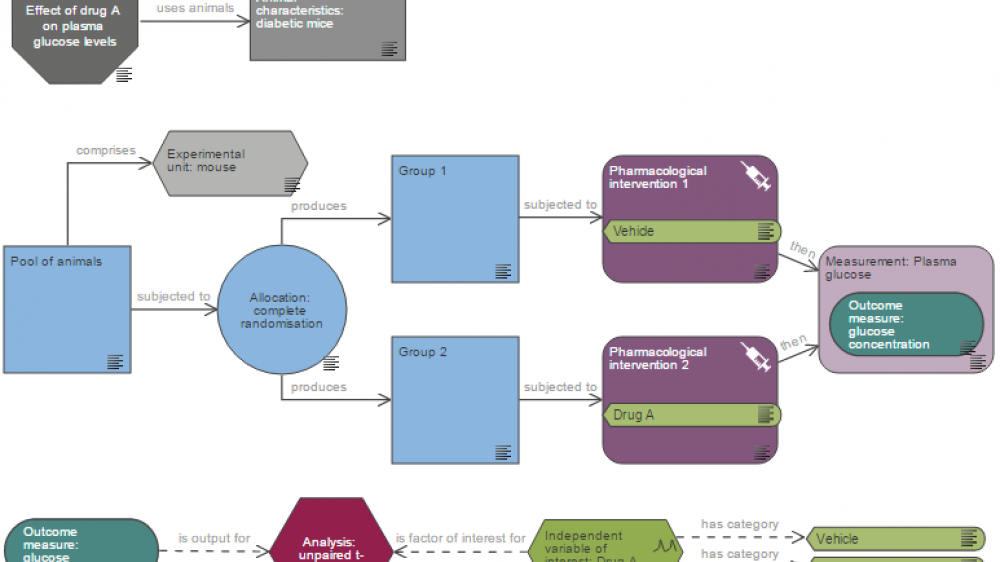
To help students learn how to use the EDA, in the first workshop we first asked them to build a flow diagram for an experiment they had been introduced to previously. In the next two workshops students used to EDA to design experiments related to their upcoming practical classes.
For example, they used the EDA to design a theoretical experiment involving mice to test if exercise increased expression of a protein in the brain (brain-derived neurotrophic factor). In the practical session students learnt a key technique that would be needed to carry out the experiment (how to extract RNA from tissue) and were given theoretical qPCR data to analyse based on their study design. They then wrote this up in the style of a short paper to understand how the EDA can be used from designing the study to reporting the results.
How did you test students’ experimental design skills?
Students were assessed on a piece of coursework using the EDA. They were given a scenario for an experiment, for example “your lab group has developed a new mouse model of multiple sclerosis, design a study to prove its validity”. They had to research that area, write a short review on the subject and design a study using the EDA. Students had been introduced to several animal models and experimental techniques in a module the previous semester, and they were encouraged to draw on this background information to help with their coursework.
We also held a support session where students could bring their EDA diagrams and we could provide one on one advice for experimental design questions and technical issues before submission.
We created a form for students to submit alongside their EDA report which provided prompts for them to collect the information they would need to design the study before opening the EDA. They also had to expand on their diagrams, including the rationale for their decisions and ethical considerations. The EDA diagrams and accompanying form made up an experimental design portfolio that accounted for one half of the assessment of the module. The other half was traditional lab reports.
What do you think the benefits of using the EDA were?
We were very impressed with the quality of the designs produced by these second-year students and they definitely understand experimental design better than previous cohorts.
In a survey over 80% of students said that the EDA helped them to develop a better understanding of the importance of sample size, of where to consider blinding and randomisation, of what an experimental unit is, of what their factors, dependent and independent variables were, and why different statistical tests are used for different study designs. All the students said that they would not have been able to produce such a rigorous experimental design without the use of the EDA and the workshops.
Were there any challenges?
There were fewer challenges than we expected, and the students picked up how to use the EDA well.
We ran the workshops in a group of 60 to 70 students with two academics. In future for the support session where students bring their designs for help and feedback, we will run smaller drop-in sessions – as this was a little more hectic than we liked!
Do you have any tips for using the EDA in undergraduate teaching?
Make sure you integrate the EDA into other activities that they are doing, rather than as a standalone session. We did this by getting them to design experiments for their upcoming practical classes, and by setting a piece of coursework which included a review of the topic as well as the experimental design portfolio. This allowed our students to contextualise the concepts of experimental design they had been learning.
Take the students slowly step-by-step through building the flow diagram in the first few workshops, before leaving them to design their own studies.
Set clear boundaries for their designs. For example, that it must use an in vivo model, and give the minimum number of outcome measures expected.
Give a clear marking criteria and set expectations. For example, a simple (two groups, two outcome measures) well-designed study, without errors, will score a high 2:1. To achieve first class marks, complex aspects such as repeated measurements, a range of nuisance variables, or more groups are required.
Any final thoughts to share?
Overall it has been very rewarding process for us and our students. We were impressed with how engaged the students were and how good their designs were. Our students have a better understanding of experimental design as they have been able to contextualise and apply these concepts and are better equipped for their final year projects next year.
We would encourage introducing the EDA into undergraduate education to set the foundations of good experimental design and support students to build their critical analysis skills.
NC3Rs resources and support
If you are new to the EDA, visit our user support pages for advice on how to get started, examples and technical support, including an overview and demonstration of the EDA. We also hold regular virtual EDA workshops for anyone involved in planning and designing experiments or teaching experimental design.
Alongside the EDA tool to build experimental diagrams, the EDA website has a library of information pages on experimental design, from the fundamentals of hypotheses, variables and outcome measures, to how to account for animal characteristics, implement randomisation and blinding, and choose the appropriate statistical analysis for an experiment. Read our EDA tips article to find out more about the features, tools and support available and make sure you are getting the most out of the EDA.
Experimental design and transparent reporting are two sides of the coin for reproducible in vivo research that uses the fewest number of animals to generate reliable results. If you are looking for resources to help students assess the quality and rigour of a research article, our ARRIVE manuscript review exercises are suitable for all levels, in tutor groups, journal clubs or individual study. Learners read and analyse an open-access animal research paper and answer questions on the quality of reporting in accordance with ARRIVE 2.0, to understand how transparent reporting enhances the reliability and reproducibility of animal research.
Design your next in vivo experiment and brush up on your experimental design knowledge.

With a wealth of information, features and tools, here are our tips to help you make the most of the EDA.

